Traces of Memory
This assignment is optional. If you don't submit it, your grade will be averaged as though this does not exist.
Reading Traces
The trace reader read method returns each reference as a Reference. This small class is defined in rdr.h, and is really more of a struct, having all public fields. Each reference has a type, InstrFetch DataFetch or Stor. The class also defines a type None, which is only used for invalid objects, not references from the program trace. It also has a (virtual) address, and size in bytes. These traces are from a Pentium or x64 architecture, so the sizes vary widely. The addresses are typed as unit64_t, defined in the header cstdint. This is an alias for a an unsigned integer type having at least 64 bits. Be careful doing arithmetic with the unsigned type in C. In particular, subtraction will never give you a negative number. If you subtract a larger unsigned from a smaller one, you just silently get the wrong answer. Ahhh, C.
This existing rprint.cpp code uses the reader and handles thes objects. Have a look. All fields are public, so there are no getters. Refer directly to the data fields.
What To Do
First, download the starting code as start.zip. This contains a class to read trace files, and a test program rprint.cpp which simply reads and prints a specified file. It will also serve quite will as a starting place for your program. It already opens the trace file, and loops through the references therein. You will also need some trace files. The linked page contains several for download, and more information about where they come from and how to make your own.
Unpack the start and get the reader to compile. On a Unix-like environment, just put the files in a directory, go there, and say make. For most IDEs, including CodeBlocks, unpack the files to some convenient place, then create a project under your IDE and add the files to it. You should then be able to build the rprint executable.
- The number of references. This is just a counter.
- The minimum, maximum and average numbers of references to a page.
- The counts of the references in each of the classes instruction fetch, data fetch, data store.
- You will need counters for the numbers of instruction fetches and data references which are “close”. You won't need to update the counters if the dist parameter is not set.
To keep a count of the number of references to each page, you should make a map from page number to count (int to int) to hold the count for each page. You could use a vector, but most of the entries will be unused, so the map saves a lot of space. For each reference, extract its page number from its address. For reference r, and b-bit pages, the expression r.addr >> b will yield the page number. (So look up the shift operator if you've never used it.) Use this page number the increment the correct entry in the map. Your map can then be used to find the min, max and average references per page, and the number of pages referenced (just the map's size).
The Reference object also gives the type of reference. You will need counters for the types (actually two, since you can subtract for the other). The type will tell you which to increment.
You need to count the “close” instructions when dist is set. Here, instruction fetches are one counter, and data stores and fetches to together for the other. Make two local Reference variables to always hold the last instruction or data reference. Use these to determine if each new reference is close to the last of the same type.
Command Line Parameters To Support
The program accepts a number of parameters on the command line. The first one is always the name of the trace file to read, and the ones which follow set parameters for the computation. The presence of some parameters also enable certain counts. In a command environment, you simply type these on the command line when running the program. An IDE will generally have some place buried in the menus where you can enter the command line parameters. In CodeBlocks, look under Project/Set Programs's Arguments, once you have created a project.
The existing rprint.cpp contains code to read the command line arguments, and process a few parameters itself, mostly as examples: If you specify limit=N, the program stops after that many references. If you say count, the program will report the number of references printed. Do have a look at it to see how this is done.
Meaning of Close
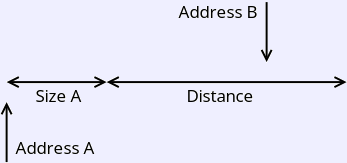 If a distance is specified, you need to check whether each reference
(after the first) is “close” to the previous one of the same type,
and count those so you can compute the percentage. More specifically, that
means that any byte covered by the first one is the address of the other,
in either direction. In the picture to the right, the reference B
is close to reference A, since it falls in the area pictured. Reference B
is close above A if it is greater than or equal Address A and less
than Address A + Size A + distance.
To test for closeness, check this in each direction.
If a distance is specified, you need to check whether each reference
(after the first) is “close” to the previous one of the same type,
and count those so you can compute the percentage. More specifically, that
means that any byte covered by the first one is the address of the other,
in either direction. In the picture to the right, the reference B
is close to reference A, since it falls in the area pictured. Reference B
is close above A if it is greater than or equal Address A and less
than Address A + Size A + distance.
To test for closeness, check this in each direction.
Where Do Traces Come From, Anyway?
They come from using the valgrind tool with a plugin called (for some reason) lackey. Lackey seems to be pretty simple, intended mainly as an example of writing plugins for Valgrind. Valgrind is available for Linux and Mac; there's no Windows port. If you have a supported platform, and have acquired valgrind, you can create a trace with this command: